Some say volatility, rather than debt, is the best way to think about risk as an investor, but Warren Buffett famously said that ‘Volatility is far from synonymous with risk.’ It’s only natural to consider a company’s balance sheet when you examine how risky it is, since debt is often involved when a business collapses. We can see that Lincoln Electric Holdings, Inc. (NASDAQ:LECO) does use debt in its business. But the real question is whether this debt is making the company risky.
When Is Debt Dangerous?
Debt assists a business until the business has trouble paying it off, either with new capital or with free cash flow. Part and parcel of capitalism is the process of ‘creative destruction’ where failed businesses are mercilessly liquidated by their bankers. However, a more usual (but still expensive) situation is where a company must dilute shareholders at a cheap share price simply to get debt under control. Of course, the upside of debt is that it often represents cheap capital, especially when it replaces dilution in a company with the ability to reinvest at high rates of return. The first step when considering a company’s debt levels is to consider its cash and debt together.
What Is Lincoln Electric Holdings’s Net Debt?
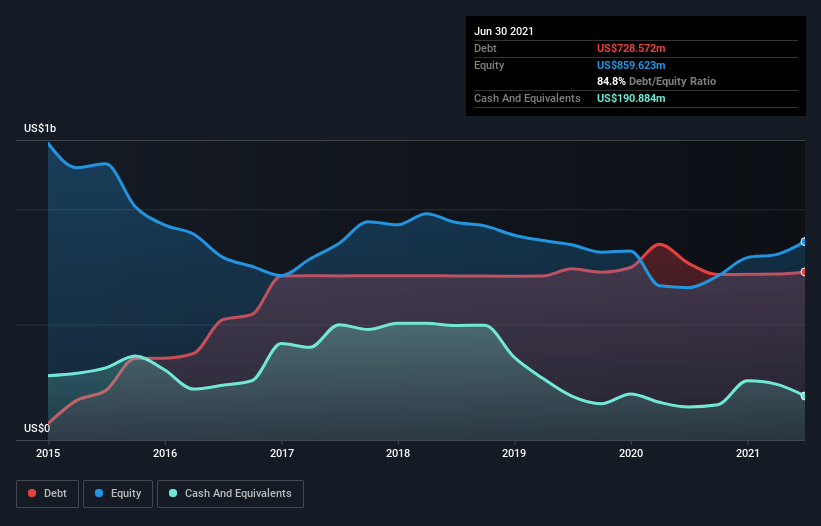
You can click the graphic below for the historical numbers, but it shows that Lincoln Electric Holdings had US$728.6m of debt in June 2021, down from US$765.5m, one year before. On the flip side, it has US$190.9m in cash leading to net debt of about US$537.7m.
How Strong Is Lincoln Electric Holdings’ Balance Sheet?
We can see from the most recent balance sheet that Lincoln Electric Holdings had liabilities of US$696.0m falling due within a year, and liabilities of US$957.1m due beyond that. On the other hand, it had cash of US$190.9m and US$480.7m worth of receivables due within a year. So it has liabilities totalling US$981.5m more than its cash and near-term receivables, combined.
Since publicly traded Lincoln Electric Holdings shares are worth a total of US$8.58b, it seems unlikely that this level of liabilities would be a major threat. Having said that, it’s clear that we should continue to monitor its balance sheet, lest it change for the worse.
In order to size up a company’s debt relative to its earnings, we calculate its net debt divided by its earnings before interest, tax, depreciation, and amortization (EBITDA) and its earnings before interest and tax (EBIT) divided by its interest expense (its interest cover). This way, we consider both the absolute quantum of the debt, as well as the interest rates paid on it.
Lincoln Electric Holdings’s net debt is only 1.2 times its EBITDA. And its EBIT easily covers its interest expense, being 17.9 times the size. So we’re pretty relaxed about its super-conservative use of debt. Also good is that Lincoln Electric Holdings grew its EBIT at 13% over the last year, further increasing its ability to manage debt. When analysing debt levels, the balance sheet is the obvious place to start. But it is future earnings, more than anything, that will determine Lincoln Electric Holdings’s ability to maintain a healthy balance sheet going forward. So if you’re focused on the future you can check out this free report showing analyst profit forecasts.
Finally, while the tax-man may adore accounting profits, lenders only accept cold hard cash. So we clearly need to look at whether that EBIT is leading to corresponding free cash flow. Over the last three years, Lincoln Electric Holdings recorded free cash flow worth a fulsome 80% of its EBIT, which is stronger than we’d usually expect. That positions it well to pay down debt if desirable to do so.
Our View
Lincoln Electric Holdings’s interest cover suggests it can handle its debt as easily as Cristiano Ronaldo could score a goal against an under 14’s goalkeeper. And the good news does not stop there, as its conversion of EBIT to free cash flow also supports that impression! Zooming out, Lincoln Electric Holdings seems to use debt quite reasonably; and that gets the nod from us. After all, sensible leverage can boost returns on equity. When analysing debt levels, the balance sheet is the obvious place to start.