
Warren Buffett famously said, ‘Volatility is far from synonymous with risk.’ It’s only natural to consider a company’s balance sheet when you examine how risky it is, since debt is often involved when a business collapses. We note that Ashland Inc. (NYSE:ASH) does have debt on its balance sheet. But is this debt a concern to shareholders?
Why Does Debt Bring Risk?
Debt is a tool to help businesses grow, but if a business is incapable of paying off its lenders, then it exists at their mercy. In the worst case scenario, a company can go bankrupt if it cannot pay its creditors. However, a more frequent (but still costly) occurrence is where a company must issue shares at bargain-basement prices, permanently diluting shareholders, just to shore up its balance sheet. Of course, the upside of debt is that it often represents cheap capital, especially when it replaces dilution in a company with the ability to reinvest at high rates of return. When we examine debt levels, we first consider both cash and debt levels, together.
How Much Debt Does Ashland Carry?
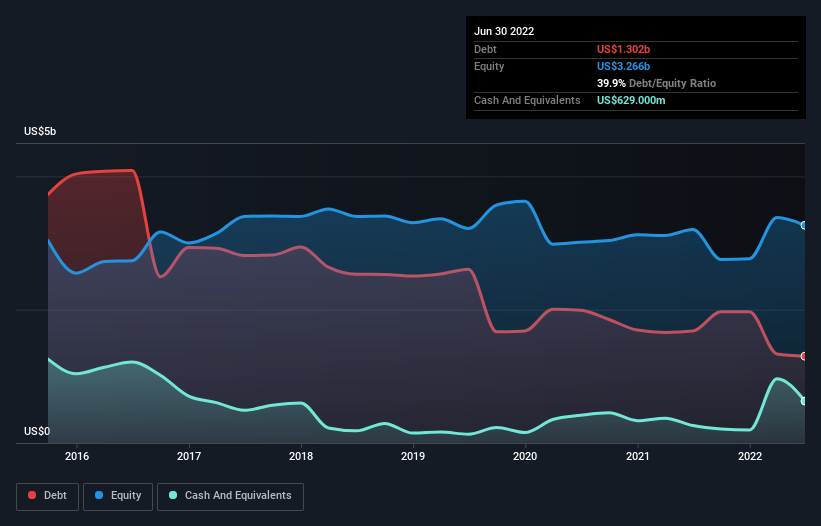
You can click the graphic below for the historical numbers, but it shows that Ashland had US$1.30b of debt in June 2022, down from US$1.68b, one year before. However, because it has a cash reserve of US$629.0m, its net debt is less, at about US$673.0m.
How Healthy Is Ashland’s Balance Sheet?
Zooming in on the latest balance sheet data, we can see that Ashland had liabilities of US$550.0m due within 12 months and liabilities of US$2.60b due beyond that. On the other hand, it had cash of US$629.0m and US$466.0m worth of receivables due within a year. So its liabilities outweigh the sum of its cash and (near-term) receivables by US$2.05b.
This deficit isn’t so bad because Ashland is worth US$5.76b, and thus could probably raise enough capital to shore up its balance sheet, if the need arose. But we definitely want to keep our eyes open to indications that its debt is bringing too much risk.
In order to size up a company’s debt relative to its earnings, we calculate its net debt divided by its earnings before interest, tax, depreciation, and amortization (EBITDA) and its earnings before interest and tax (EBIT) divided by its interest expense (its interest cover). The advantage of this approach is that we take into account both the absolute quantum of debt (with net debt to EBITDA) and the actual interest expenses associated with that debt (with its interest cover ratio).
While Ashland’s low debt to EBITDA ratio of 1.3 suggests only modest use of debt, the fact that EBIT only covered the interest expense by 4.5 times last year does give us pause. But the interest payments are certainly sufficient to have us thinking about how affordable its debt is. Notably, Ashland’s EBIT launched higher than Elon Musk, gaining a whopping 266% on last year. When analysing debt levels, the balance sheet is the obvious place to start. But ultimately the future profitability of the business will decide if Ashland can strengthen its balance sheet over time.
Finally, a business needs free cash flow to pay off debt; accounting profits just don’t cut it. So we clearly need to look at whether that EBIT is leading to corresponding free cash flow. Over the most recent three years, Ashland recorded free cash flow worth 53% of its EBIT, which is around normal, given free cash flow excludes interest and tax. This cold hard cash means it can reduce its debt when it wants to.
Our View
The good news is that Ashland’s demonstrated ability to grow its EBIT delights us like a fluffy puppy does a toddler. But, on a more sombre note, we are a little concerned by its interest cover. Looking at all the aforementioned factors together, it strikes us that Ashland can handle its debt fairly comfortably. On the plus side, this leverage can boost shareholder returns, but the potential downside is more risk of loss, so it’s worth monitoring the balance sheet. The balance sheet is clearly the area to focus on when you are analysing debt.