
The external fund manager backed by Berkshire Hathaway’s Charlie Munger, Li Lu, makes no bones about it when he says ‘The biggest investment risk is not the volatility of prices, but whether you will suffer a permanent loss of capital.’ It’s only natural to consider a company’s balance sheet when you examine how risky it is, since debt is often involved when a business collapses. Importantly, TransUnion (NYSE:TRU) does carry debt. But the real question is whether this debt is making the company risky.
Why Does Debt Bring Risk?
Debt and other liabilities become risky for a business when it cannot easily fulfill those obligations, either with free cash flow or by raising capital at an attractive price. In the worst case scenario, a company can go bankrupt if it cannot pay its creditors. However, a more common (but still painful) scenario is that it has to raise new equity capital at a low price, thus permanently diluting shareholders. Of course, plenty of companies use debt to fund growth, without any negative consequences. The first thing to do when considering how much debt a business uses is to look at its cash and debt together.
What Is TransUnion’s Debt?
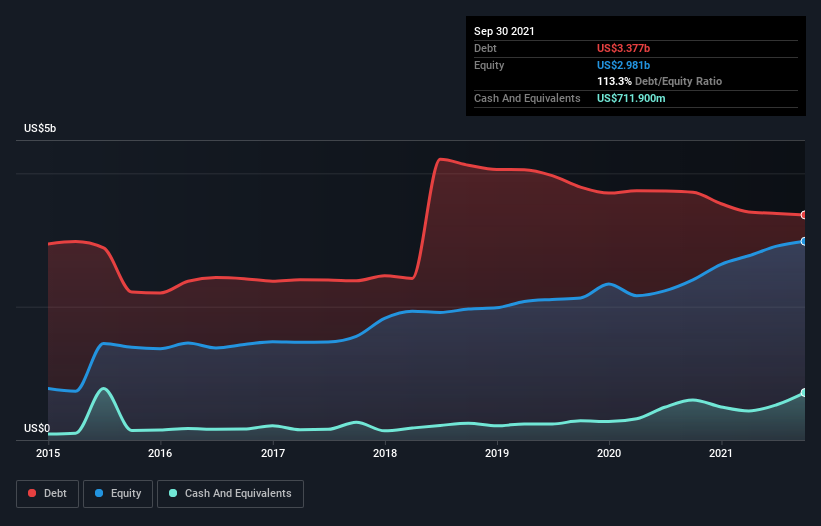
As you can see below, TransUnion had US$3.38b of debt at September 2021, down from US$3.72b a year prior. However, because it has a cash reserve of US$711.9m, its net debt is less, at about US$2.66b.
How Strong Is TransUnion’s Balance Sheet?
Zooming in on the latest balance sheet data, we can see that TransUnion had liabilities of US$680.0m due within 12 months and liabilities of US$3.85b due beyond that. Offsetting these obligations, it had cash of US$711.9m as well as receivables valued at US$514.3m due within 12 months. So its liabilities outweigh the sum of its cash and (near-term) receivables by US$3.30b.
Of course, TransUnion has a titanic market capitalization of US$22.2b, so these liabilities are probably manageable. However, we do think it is worth keeping an eye on its balance sheet strength, as it may change over time.
In order to size up a company’s debt relative to its earnings, we calculate its net debt divided by its earnings before interest, tax, depreciation, and amortization (EBITDA) and its earnings before interest and tax (EBIT) divided by its interest expense (its interest cover). This way, we consider both the absolute quantum of the debt, as well as the interest rates paid on it.
With a debt to EBITDA ratio of 2.4, TransUnion uses debt artfully but responsibly. And the alluring interest cover (EBIT of 7.5 times interest expense) certainly does not do anything to dispel this impression. We note that TransUnion grew its EBIT by 21% in the last year, and that should make it easier to pay down debt, going forward. There’s no doubt that we learn most about debt from the balance sheet. But it is future earnings, more than anything, that will determine TransUnion’s ability to maintain a healthy balance sheet going forward.
Finally, while the tax-man may adore accounting profits, lenders only accept cold hard cash. So it’s worth checking how much of that EBIT is backed by free cash flow. During the last three years, TransUnion generated free cash flow amounting to a very robust 90% of its EBIT, more than we’d expect. That positions it well to pay down debt if desirable to do so.
Our View
Happily, TransUnion’s impressive conversion of EBIT to free cash flow implies it has the upper hand on its debt. And the good news does not stop there, as its EBIT growth rate also supports that impression! Zooming out, TransUnion seems to use debt quite reasonably; and that gets the nod from us. While debt does bring risk, when used wisely it can also bring a higher return on equity. When analysing debt levels, the balance sheet is the obvious place to start. But ultimately, every company can contain risks that exist outside of the balance sheet.