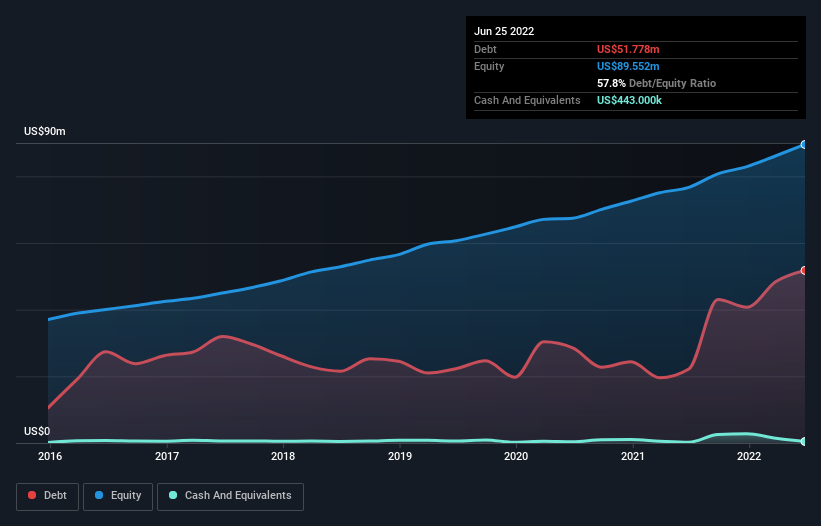
Some say volatility, rather than debt, is the best way to think about risk as an investor, but Warren Buffett famously said that ‘Volatility is far from synonymous with risk.’ When we think about how risky a company is, we always like to look at its use of debt, since debt overload can lead to ruin. We can see that Transcat, Inc. (NASDAQ:TRNS) does use debt in its business. But should shareholders be worried about its use of debt?
When Is Debt A Problem?
Debt and other liabilities become risky for a business when it cannot easily fulfill those obligations, either with free cash flow or by raising capital at an attractive price. Ultimately, if the company can’t fulfill its legal obligations to repay debt, shareholders could walk away with nothing. However, a more common (but still painful) scenario is that it has to raise new equity capital at a low price, thus permanently diluting shareholders. Having said that, the most common situation is where a company manages its debt reasonably well – and to its own advantage. When we examine debt levels, we first consider both cash and debt levels, together.
What Is Transcat’s Debt?
You can click the graphic below for the historical numbers, but it shows that as of June 2022 Transcat had US$51.8m of debt, an increase on US$22.2m, over one year. And it doesn’t have much cash, so its net debt is about the same.

How Strong Is Transcat’s Balance Sheet?
According to the last reported balance sheet, Transcat had liabilities of US$23.7m due within 12 months, and liabilities of US$68.8m due beyond 12 months. Offsetting this, it had US$443.0k in cash and US$38.6m in receivables that were due within 12 months. So its liabilities outweigh the sum of its cash and (near-term) receivables by US$53.5m.
Since publicly traded Transcat shares are worth a total of US$593.6m, it seems unlikely that this level of liabilities would be a major threat. However, we do think it is worth keeping an eye on its balance sheet strength, as it may change over time.
In order to size up a company’s debt relative to its earnings, we calculate its net debt divided by its earnings before interest, tax, depreciation, and amortization (EBITDA) and its earnings before interest and tax (EBIT) divided by its interest expense (its interest cover). The advantage of this approach is that we take into account both the absolute quantum of debt (with net debt to EBITDA) and the actual interest expenses associated with that debt (with its interest cover ratio).
We’d say that Transcat’s moderate net debt to EBITDA ratio ( being 2.0), indicates prudence when it comes to debt. And its strong interest cover of 19.4 times, makes us even more comfortable. We saw Transcat grow its EBIT by 8.7% in the last twelve months. That’s far from incredible but it is a good thing, when it comes to paying off debt. There’s no doubt that we learn most about debt from the balance sheet. But ultimately the future profitability of the business will decide if Transcat can strengthen its balance sheet over time.
Finally, while the tax-man may adore accounting profits, lenders only accept cold hard cash. So we clearly need to look at whether that EBIT is leading to corresponding free cash flow. Over the most recent three years, Transcat recorded free cash flow worth 77% of its EBIT, which is around normal, given free cash flow excludes interest and tax. This cold hard cash means it can reduce its debt when it wants to.
Our View
Transcat’s interest cover suggests it can handle its debt as easily as Cristiano Ronaldo could score a goal against an under 14’s goalkeeper. And the good news does not stop there, as its conversion of EBIT to free cash flow also supports that impression! Zooming out, Transcat seems to use debt quite reasonably; and that gets the nod from us. While debt does bring risk, when used wisely it can also bring a higher return on equity. There’s no doubt that we learn most about debt from the balance sheet.


