
Legendary fund manager Li Lu (who Charlie Munger backed) once said, ‘The biggest investment risk is not the volatility of prices, but whether you will suffer a permanent loss of capital.’ So it seems the smart money knows that debt – which is usually involved in bankruptcies – is a very important factor, when you assess how risky a company is. We can see that Owens Corning (NYSE:OC) does use debt in its business. But the more important question is: how much risk is that debt creating?
When Is Debt Dangerous?
Debt assists a business until the business has trouble paying it off, either with new capital or with free cash flow. Ultimately, if the company can’t fulfill its legal obligations to repay debt, shareholders could walk away with nothing. However, a more usual (but still expensive) situation is where a company must dilute shareholders at a cheap share price simply to get debt under control. By replacing dilution, though, debt can be an extremely good tool for businesses that need capital to invest in growth at high rates of return. The first thing to do when considering how much debt a business uses is to look at its cash and debt together.
How Much Debt Does Owens Corning Carry?
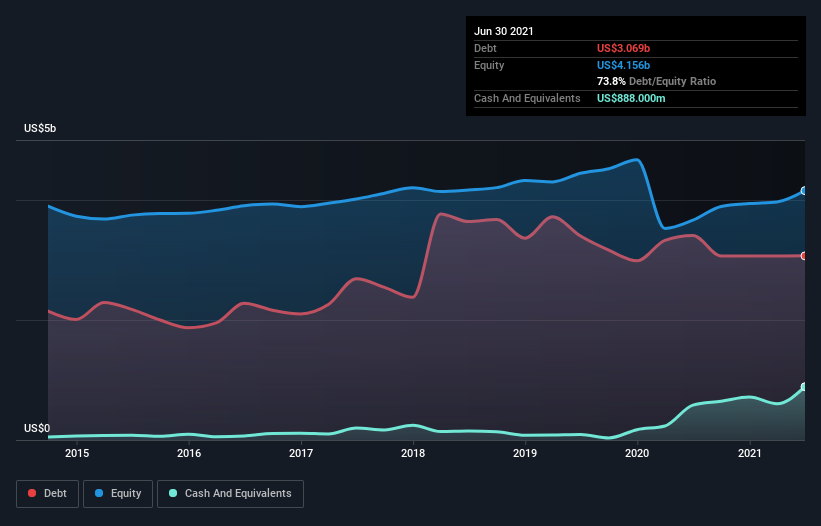
You can click the graphic below for the historical numbers, but it shows that Owens Corning had US$3.07b of debt in June 2021, down from US$3.41b, one year before. On the flip side, it has US$888.0m in cash leading to net debt of about US$2.18b.
How Healthy Is Owens Corning’s Balance Sheet?
The latest balance sheet data shows that Owens Corning had liabilities of US$1.64b due within a year, and liabilities of US$4.18b falling due after that. On the other hand, it had cash of US$888.0m and US$1.23b worth of receivables due within a year. So its liabilities total US$3.71b more than the combination of its cash and short-term receivables.
This deficit isn’t so bad because Owens Corning is worth US$9.92b, and thus could probably raise enough capital to shore up its balance sheet, if the need arose. However, it is still worthwhile taking a close look at its ability to pay off debt.
We use two main ratios to inform us about debt levels relative to earnings. The first is net debt divided by earnings before interest, tax, depreciation, and amortization (EBITDA), while the second is how many times its earnings before interest and tax (EBIT) covers its interest expense (or its interest cover, for short). Thus we consider debt relative to earnings both with and without depreciation and amortization expenses.
With net debt sitting at just 1.3 times EBITDA, Owens Corning is arguably pretty conservatively geared. And this view is supported by the solid interest coverage, with EBIT coming in at 9.3 times the interest expense over the last year. In addition to that, we’re happy to report that Owens Corning has boosted its EBIT by 72%, thus reducing the spectre of future debt repayments. When analysing debt levels, the balance sheet is the obvious place to start. But it is future earnings, more than anything, that will determine Owens Corning’s ability to maintain a healthy balance sheet going forward. So if you want to see what the professionals think, you might find this free report on analyst profit forecasts to be interesting.
Finally, a business needs free cash flow to pay off debt; accounting profits just don’t cut it. So we clearly need to look at whether that EBIT is leading to corresponding free cash flow. Over the most recent three years, Owens Corning recorded free cash flow worth 77% of its EBIT, which is around normal, given free cash flow excludes interest and tax. This free cash flow puts the company in a good position to pay down debt, when appropriate.
Our View
Owens Corning’s EBIT growth rate suggests it can handle its debt as easily as Cristiano Ronaldo could score a goal against an under 14’s goalkeeper. And the good news does not stop there, as its conversion of EBIT to free cash flow also supports that impression! Zooming out, Owens Corning seems to use debt quite reasonably; and that gets the nod from us. After all, sensible leverage can boost returns on equity.