
Howard Marks put it nicely when he said that, rather than worrying about share price volatility, ‘The possibility of permanent loss is the risk I worry about… and every practical investor I know worries about.’ When we think about how risky a company is, we always like to look at its use of debt, since debt overload can lead to ruin. We note that The Middleby Corporation (NASDAQ:MIDD) does have debt on its balance sheet. But the real question is whether this debt is making the company risky.
Why Does Debt Bring Risk?
Debt assists a business until the business has trouble paying it off, either with new capital or with free cash flow. Ultimately, if the company can’t fulfill its legal obligations to repay debt, shareholders could walk away with nothing. However, a more common (but still painful) scenario is that it has to raise new equity capital at a low price, thus permanently diluting shareholders. Having said that, the most common situation is where a company manages its debt reasonably well – and to its own advantage. When we think about a company’s use of debt, we first look at cash and debt together.
What Is Middleby’s Debt?
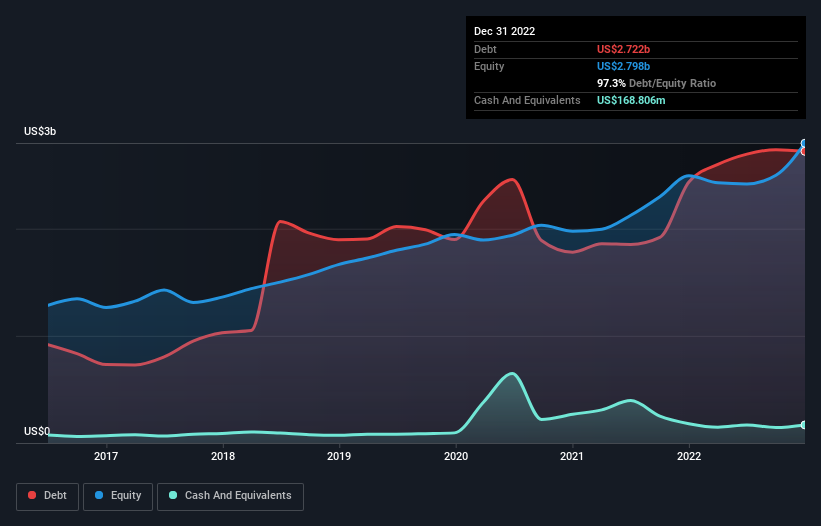
The image below, which you can click on for greater detail, shows that at December 2022 Middleby had debt of US$2.72b, up from US$2.44b in one year. However, it also had US$168.8m in cash, and so its net debt is US$2.55b.
How Healthy Is Middleby’s Balance Sheet?
Zooming in on the latest balance sheet data, we can see that Middleby had liabilities of US$988.3m due within 12 months and liabilities of US$3.09b due beyond that. Offsetting this, it had US$168.8m in cash and US$671.6m in receivables that were due within 12 months. So it has liabilities totalling US$3.24b more than its cash and near-term receivables, combined.
This deficit isn’t so bad because Middleby is worth US$7.86b, and thus could probably raise enough capital to shore up its balance sheet, if the need arose. However, it is still worthwhile taking a close look at its ability to pay off debt.
We use two main ratios to inform us about debt levels relative to earnings. The first is net debt divided by earnings before interest, tax, depreciation, and amortization (EBITDA), while the second is how many times its earnings before interest and tax (EBIT) covers its interest expense (or its interest cover, for short). The advantage of this approach is that we take into account both the absolute quantum of debt (with net debt to EBITDA) and the actual interest expenses associated with that debt (with its interest cover ratio).
Middleby has net debt to EBITDA of 3.1 suggesting it uses a fair bit of leverage to boost returns. But the high interest coverage of 7.8 suggests it can easily service that debt. If Middleby can keep growing EBIT at last year’s rate of 17% over the last year, then it will find its debt load easier to manage. The balance sheet is clearly the area to focus on when you are analysing debt. But ultimately the future profitability of the business will decide if Middleby can strengthen its balance sheet over time.
Finally, while the tax-man may adore accounting profits, lenders only accept cold hard cash. So it’s worth checking how much of that EBIT is backed by free cash flow. Over the most recent three years, Middleby recorded free cash flow worth 67% of its EBIT, which is around normal, given free cash flow excludes interest and tax. This free cash flow puts the company in a good position to pay down debt, when appropriate.
Our View
The good news is that Middleby’s demonstrated ability to convert EBIT to free cash flow delights us like a fluffy puppy does a toddler. But, on a more sombre note, we are a little concerned by its net debt to EBITDA. Looking at all the aforementioned factors together, it strikes us that Middleby can handle its debt fairly comfortably. Of course, while this leverage can enhance returns on equity, it does bring more risk, so it’s worth keeping an eye on this one.