
Warren Buffett famously said, ‘Volatility is far from synonymous with risk.’ So it might be obvious that you need to consider debt, when you think about how risky any given stock is, because too much debt can sink a company. As with many other companies Clean Harbors, Inc. (NYSE:CLH) makes use of debt. But the more important question is: how much risk is that debt creating?
When Is Debt Dangerous?
Debt and other liabilities become risky for a business when it cannot easily fulfill those obligations, either with free cash flow or by raising capital at an attractive price. In the worst case scenario, a company can go bankrupt if it cannot pay its creditors. However, a more common (but still painful) scenario is that it has to raise new equity capital at a low price, thus permanently diluting shareholders. Of course, debt can be an important tool in businesses, particularly capital heavy businesses. The first step when considering a company’s debt levels is to consider its cash and debt together.
What Is Clean Harbors’s Net Debt?
As you can see below, Clean Harbors had US$1.58b of debt at June 2021, down from US$1.67b a year prior. However, it does have US$666.3m in cash offsetting this, leading to net debt of about US$914.6m.
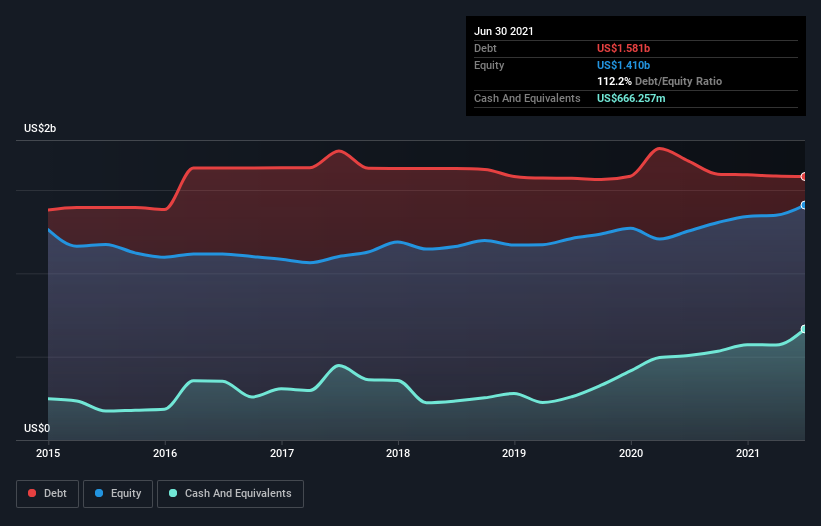
A Look At Clean Harbors’ Liabilities
The latest balance sheet data shows that Clean Harbors had liabilities of US$711.1m due within a year, and liabilities of US$2.16b falling due after that. On the other hand, it had cash of US$666.3m and US$718.8m worth of receivables due within a year. So its liabilities total US$1.48b more than the combination of its cash and short-term receivables.
Clean Harbors has a market capitalization of US$6.29b, so it could very likely raise cash to ameliorate its balance sheet, if the need arose. However, it is still worthwhile taking a close look at its ability to pay off debt.
We use two main ratios to inform us about debt levels relative to earnings. The first is net debt divided by earnings before interest, tax, depreciation, and amortization (EBITDA), while the second is how many times its earnings before interest and tax (EBIT) covers its interest expense (or its interest cover, for short). This way, we consider both the absolute quantum of the debt, as well as the interest rates paid on it.
Clean Harbors has net debt worth 1.6 times EBITDA, which isn’t too much, but its interest cover looks a bit on the low side, with EBIT at only 3.9 times the interest expense. It seems that the business incurs large depreciation and amortisation charges, so maybe its debt load is heavier than it would first appear, since EBITDA is arguably a generous measure of earnings. We note that Clean Harbors grew its EBIT by 29% in the last year, and that should make it easier to pay down debt, going forward. The balance sheet is clearly the area to focus on when you are analysing debt. But ultimately the future profitability of the business will decide if Clean Harbors can strengthen its balance sheet over time. So if you want to see what the professionals think, you might find this free report on analyst profit forecasts to be interesting.
Finally, a business needs free cash flow to pay off debt; accounting profits just don’t cut it. So it’s worth checking how much of that EBIT is backed by free cash flow. Happily for any shareholders, Clean Harbors actually produced more free cash flow than EBIT over the last three years. There’s nothing better than incoming cash when it comes to staying in your lenders’ good graces.
Our View
The good news is that Clean Harbors’s demonstrated ability to convert EBIT to free cash flow delights us like a fluffy puppy does a toddler. But truth be told we feel its interest cover does undermine this impression a bit. Zooming out, Clean Harbors seems to use debt quite reasonably; and that gets the nod from us. After all, sensible leverage can boost returns on equity. There’s no doubt that we learn most about debt from the balance sheet.