
Legendary fund manager Li Lu (who Charlie Munger backed) once said, ‘The biggest investment risk is not the volatility of prices, but whether you will suffer a permanent loss of capital.’ It’s only natural to consider a company’s balance sheet when you examine how risky it is, since debt is often involved when a business collapses. We can see that Blackbaud, Inc. (NASDAQ:BLKB) does use debt in its business. But the real question is whether this debt is making the company risky.
Why Does Debt Bring Risk?
Debt assists a business until the business has trouble paying it off, either with new capital or with free cash flow. Ultimately, if the company can’t fulfill its legal obligations to repay debt, shareholders could walk away with nothing. However, a more frequent (but still costly) occurrence is where a company must issue shares at bargain-basement prices, permanently diluting shareholders, just to shore up its balance sheet. By replacing dilution, though, debt can be an extremely good tool for businesses that need capital to invest in growth at high rates of return. When we examine debt levels, we first consider both cash and debt levels, together.
What Is Blackbaud’s Debt?
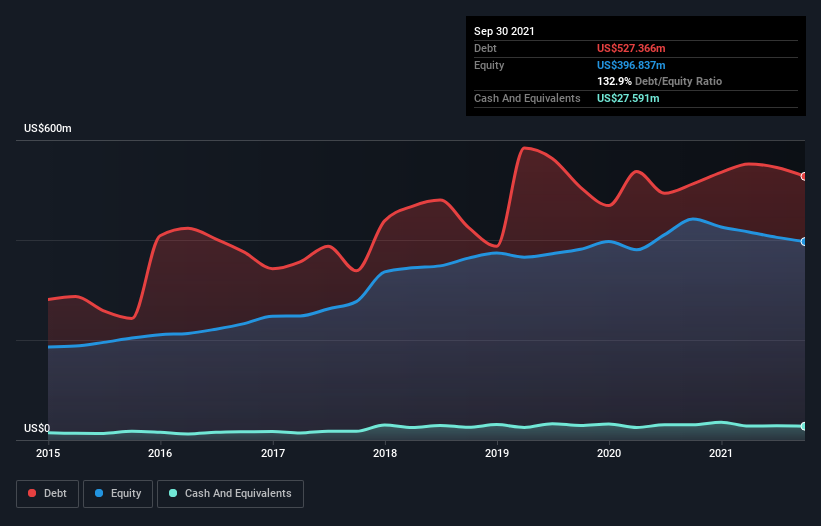
As you can see below, Blackbaud had US$527.4m of debt, at September 2021, which is about the same as the year before. You can click the chart for greater detail. However, because it has a cash reserve of US$27.6m, its net debt is less, at about US$499.8m.
How Strong Is Blackbaud’s Balance Sheet?
We can see from the most recent balance sheet that Blackbaud had liabilities of US$660.1m falling due within a year, and liabilities of US$598.0m due beyond that. On the other hand, it had cash of US$27.6m and US$105.9m worth of receivables due within a year. So its liabilities outweigh the sum of its cash and (near-term) receivables by US$1.12b.
This deficit isn’t so bad because Blackbaud is worth US$3.83b, and thus could probably raise enough capital to shore up its balance sheet, if the need arose. But we definitely want to keep our eyes open to indications that its debt is bringing too much risk.
We use two main ratios to inform us about debt levels relative to earnings. The first is net debt divided by earnings before interest, tax, depreciation, and amortization (EBITDA), while the second is how many times its earnings before interest and tax (EBIT) covers its interest expense (or its interest cover, for short). The advantage of this approach is that we take into account both the absolute quantum of debt (with net debt to EBITDA) and the actual interest expenses associated with that debt (with its interest cover ratio).
Blackbaud shareholders face the double whammy of a high net debt to EBITDA ratio (7.0), and fairly weak interest coverage, since EBIT is just 1.0 times the interest expense. The debt burden here is substantial. Even worse, Blackbaud saw its EBIT tank 57% over the last 12 months. If earnings continue to follow that trajectory, paying off that debt load will be harder than convincing us to run a marathon in the rain. When analysing debt levels, the balance sheet is the obvious place to start. But ultimately the future profitability of the business will decide if Blackbaud can strengthen its balance sheet over time.
Finally, while the tax-man may adore accounting profits, lenders only accept cold hard cash. So it’s worth checking how much of that EBIT is backed by free cash flow. Happily for any shareholders, Blackbaud actually produced more free cash flow than EBIT over the last three years. There’s nothing better than incoming cash when it comes to staying in your lenders’ good graces.
Our View
Blackbaud’s EBIT growth rate and interest cover definitely weigh on it, in our esteem. But the good news is it seems to be able to convert EBIT to free cash flow with ease. Taking the abovementioned factors together we do think Blackbaud’s debt poses some risks to the business. While that debt can boost returns, we think the company has enough leverage now. The balance sheet is clearly the area to focus on when you are analysing debt.