
Warren Buffett famously said, ‘Volatility is far from synonymous with risk.’ So it might be obvious that you need to consider debt, when you think about how risky any given stock is, because too much debt can sink a company. As with many other companies Harmonic Inc. (NASDAQ:HLIT) makes use of debt. But the more important question is: how much risk is that debt creating?
What Risk Does Debt Bring?
Generally speaking, debt only becomes a real problem when a company can’t easily pay it off, either by raising capital or with its own cash flow. In the worst case scenario, a company can go bankrupt if it cannot pay its creditors. However, a more common (but still painful) scenario is that it has to raise new equity capital at a low price, thus permanently diluting shareholders. Of course, debt can be an important tool in businesses, particularly capital heavy businesses. The first step when considering a company’s debt levels is to consider its cash and debt together.
What Is Harmonic’s Net Debt?
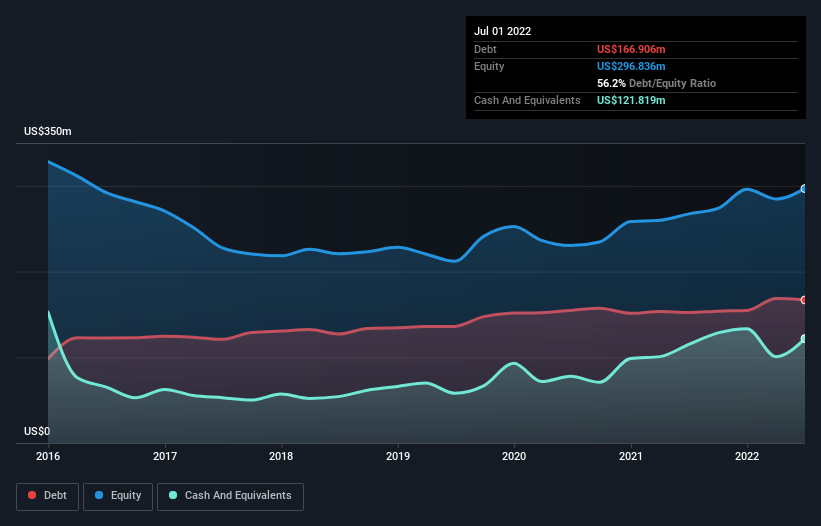
As you can see below, at the end of July 2022, Harmonic had US$166.9m of debt, up from US$152.2m a year ago. Click the image for more detail. However, it does have US$121.8m in cash offsetting this, leading to net debt of about US$45.1m.
A Look At Harmonic’s Liabilities
The latest balance sheet data shows that Harmonic had liabilities of US$222.0m due within a year, and liabilities of US$179.6m falling due after that. Offsetting this, it had US$121.8m in cash and US$111.1m in receivables that were due within 12 months. So its liabilities total US$168.7m more than the combination of its cash and short-term receivables.
Given Harmonic has a market capitalization of US$1.42b, it’s hard to believe these liabilities pose much threat. Having said that, it’s clear that we should continue to monitor its balance sheet, lest it change for the worse.
We use two main ratios to inform us about debt levels relative to earnings. The first is net debt divided by earnings before interest, tax, depreciation, and amortization (EBITDA), while the second is how many times its earnings before interest and tax (EBIT) covers its interest expense (or its interest cover, for short). This way, we consider both the absolute quantum of the debt, as well as the interest rates paid on it.
While Harmonic’s low debt to EBITDA ratio of 0.85 suggests only modest use of debt, the fact that EBIT only covered the interest expense by 4.9 times last year does give us pause. But the interest payments are certainly sufficient to have us thinking about how affordable its debt is. Pleasingly, Harmonic is growing its EBIT faster than former Australian PM Bob Hawke downs a yard glass, boasting a 145% gain in the last twelve months. There’s no doubt that we learn most about debt from the balance sheet. But it is future earnings, more than anything, that will determine Harmonic’s ability to maintain a healthy balance sheet going forward.
Finally, while the tax-man may adore accounting profits, lenders only accept cold hard cash. So we clearly need to look at whether that EBIT is leading to corresponding free cash flow. Over the last three years, Harmonic recorded free cash flow worth a fulsome 84% of its EBIT, which is stronger than we’d usually expect. That positions it well to pay down debt if desirable to do so.
Our View
Harmonic’s conversion of EBIT to free cash flow suggests it can handle its debt as easily as Cristiano Ronaldo could score a goal against an under 14’s goalkeeper. And the good news does not stop there, as its EBIT growth rate also supports that impression! Looking at the bigger picture, we think Harmonic’s use of debt seems quite reasonable and we’re not concerned about it. After all, sensible leverage can boost returns on equity. When analysing debt levels, the balance sheet is the obvious place to start.