


The external fund manager backed by Berkshire Hathaway’s Charlie Munger, Li Lu, makes no bones about it when he says ‘The biggest investment risk is not the volatility of prices, but whether you will suffer a permanent loss of capital.’ It’s only natural to consider a company’s balance sheet when you examine how risky it is, since debt is often involved when a business collapses. We note that The Container Store Group, Inc. (NYSE:TCS) does have debt on its balance sheet. But the more important question is: how much risk is that debt creating?
Why Does Debt Bring Risk?
Debt is a tool to help businesses grow, but if a business is incapable of paying off its lenders, then it exists at their mercy. Ultimately, if the company can’t fulfill its legal obligations to repay debt, shareholders could walk away with nothing. While that is not too common, we often do see indebted companies permanently diluting shareholders because lenders force them to raise capital at a distressed price. Of course, debt can be an important tool in businesses, particularly capital heavy businesses. When we examine debt levels, we first consider both cash and debt levels, together.
What Is Container Store Group’s Net Debt?
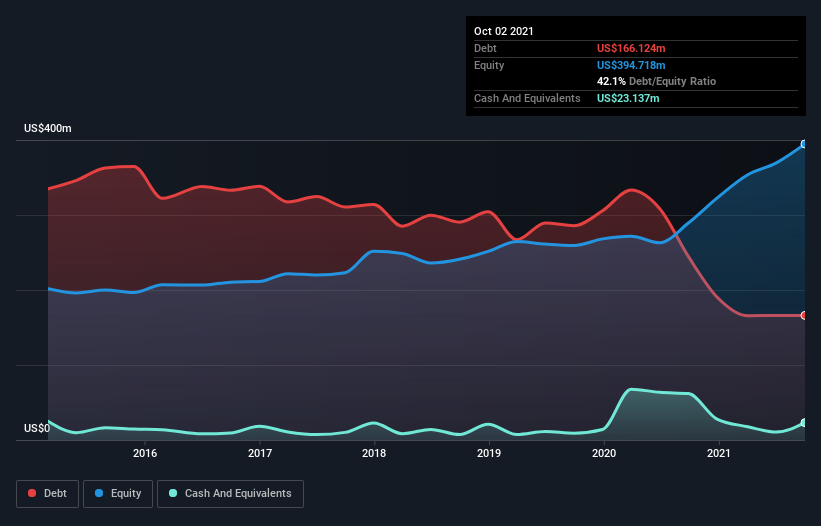
You can click the graphic below for the historical numbers, but it shows that Container Store Group had US$166.1m of debt in October 2021, down from US$244.8m, one year before. However, it does have US$23.1m in cash offsetting this, leading to net debt of about US$143.0m.
How Strong Is Container Store Group’s Balance Sheet?
We can see from the most recent balance sheet that Container Store Group had liabilities of US$227.3m falling due within a year, and liabilities of US$501.2m due beyond that. Offsetting this, it had US$23.1m in cash and US$31.9m in receivables that were due within 12 months. So its liabilities outweigh the sum of its cash and (near-term) receivables by US$673.5m.
When you consider that this deficiency exceeds the company’s US$580.4m market capitalization, you might well be inclined to review the balance sheet intently. In the scenario where the company had to clean up its balance sheet quickly, it seems likely shareholders would suffer extensive dilution.
In order to size up a company’s debt relative to its earnings, we calculate its net debt divided by its earnings before interest, tax, depreciation, and amortization (EBITDA) and its earnings before interest and tax (EBIT) divided by its interest expense (its interest cover). Thus we consider debt relative to earnings both with and without depreciation and amortization expenses.
Container Store Group has net debt of just 0.84 times EBITDA, indicating that it is certainly not a reckless borrower. And this view is supported by the solid interest coverage, with EBIT coming in at 9.9 times the interest expense over the last year. Better yet, Container Store Group grew its EBIT by 126% last year, which is an impressive improvement. If maintained that growth will make the debt even more manageable in the years ahead. There’s no doubt that we learn most about debt from the balance sheet. But ultimately the future profitability of the business will decide if Container Store Group can strengthen its balance sheet over time.
Finally, a business needs free cash flow to pay off debt; accounting profits just don’t cut it. So the logical step is to look at the proportion of that EBIT that is matched by actual free cash flow. During the last three years, Container Store Group produced sturdy free cash flow equating to 60% of its EBIT, about what we’d expect. This cold hard cash means it can reduce its debt when it wants to.
Our View
When it comes to the balance sheet, the standout positive for Container Store Group was the fact that it seems able to grow its EBIT confidently. However, our other observations weren’t so heartening. In particular, level of total liabilities gives us cold feet. Considering this range of data points, we think Container Store Group is in a good position to manage its debt levels. But a word of caution: we think debt levels are high enough to justify ongoing monitoring. When analysing debt levels, the balance sheet is the obvious place to start.


