


David Iben put it well when he said, ‘Volatility is not a risk we care about. What we care about is avoiding the permanent loss of capital.’ So it might be obvious that you need to consider debt, when you think about how risky any given stock is, because too much debt can sink a company. Importantly, Casey’s General Stores, Inc. (NASDAQ:CASY) does carry debt. But is this debt a concern to shareholders?
When Is Debt Dangerous?
Debt and other liabilities become risky for a business when it cannot easily fulfill those obligations, either with free cash flow or by raising capital at an attractive price. Part and parcel of capitalism is the process of ‘creative destruction’ where failed businesses are mercilessly liquidated by their bankers. However, a more usual (but still expensive) situation is where a company must dilute shareholders at a cheap share price simply to get debt under control. Of course, the upside of debt is that it often represents cheap capital, especially when it replaces dilution in a company with the ability to reinvest at high rates of return. When we examine debt levels, we first consider both cash and debt levels, together.
How Much Debt Does Casey’s General Stores Carry?
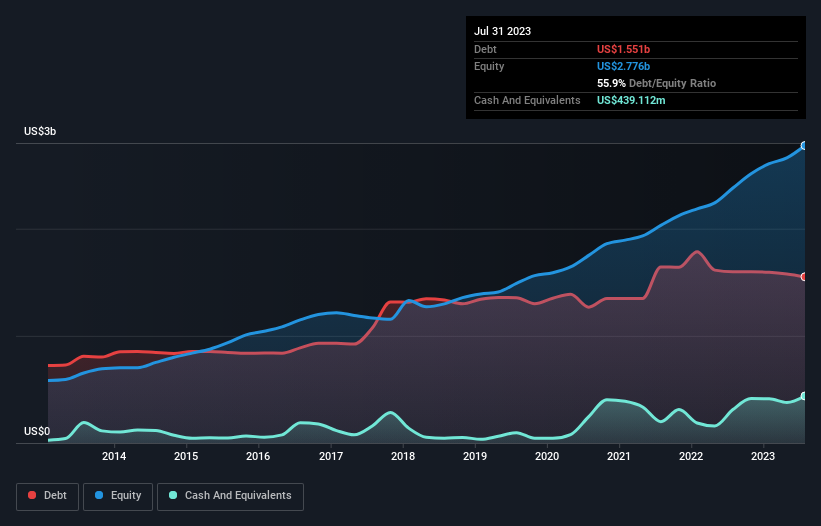
As you can see below, Casey’s General Stores had US$1.55b of debt, at July 2023, which is about the same as the year before. You can click the chart for greater detail. However, because it has a cash reserve of US$439.1m, its net debt is less, at about US$1.11b.
How Strong Is Casey’s General Stores’ Balance Sheet?
Zooming in on the latest balance sheet data, we can see that Casey’s General Stores had liabilities of US$934.0m due within 12 months and liabilities of US$2.35b due beyond that. Offsetting this, it had US$439.1m in cash and US$133.7m in receivables that were due within 12 months. So it has liabilities totalling US$2.71b more than its cash and near-term receivables, combined.
While this might seem like a lot, it is not so bad since Casey’s General Stores has a huge market capitalization of US$10.2b, and so it could probably strengthen its balance sheet by raising capital if it needed to. But we definitely want to keep our eyes open to indications that its debt is bringing too much risk.
We measure a company’s debt load relative to its earnings power by looking at its net debt divided by its earnings before interest, tax, depreciation, and amortization (EBITDA) and by calculating how easily its earnings before interest and tax (EBIT) cover its interest expense (interest cover). This way, we consider both the absolute quantum of the debt, as well as the interest rates paid on it.
Casey’s General Stores has a low net debt to EBITDA ratio of only 1.2. And its EBIT easily covers its interest expense, being 12.8 times the size. So we’re pretty relaxed about its super-conservative use of debt. Also good is that Casey’s General Stores grew its EBIT at 17% over the last year, further increasing its ability to manage debt. When analysing debt levels, the balance sheet is the obvious place to start. But it is future earnings, more than anything, that will determine Casey’s General Stores’s ability to maintain a healthy balance sheet going forward.
But our final consideration is also important, because a company cannot pay debt with paper profits; it needs cold hard cash. So it’s worth checking how much of that EBIT is backed by free cash flow. During the last three years, Casey’s General Stores produced sturdy free cash flow equating to 65% of its EBIT, about what we’d expect. This free cash flow puts the company in a good position to pay down debt, when appropriate.
Our View
Casey’s General Stores’s interest cover suggests it can handle its debt as easily as Cristiano Ronaldo could score a goal against an under 14’s goalkeeper. And that’s just the beginning of the good news since its conversion of EBIT to free cash flow is also very heartening. When we consider the range of factors above, it looks like Casey’s General Stores is pretty sensible with its use of debt. That means they are taking on a bit more risk, in the hope of boosting shareholder returns. The balance sheet is clearly the area to focus on when you are analysing debt.


