


David Iben put it well when he said, ‘Volatility is not a risk we care about. What we care about is avoiding the permanent loss of capital.’ It’s only natural to consider a company’s balance sheet when you examine how risky it is, since debt is often involved when a business collapses. We can see that Cars.com Inc. (NYSE:CARS) does use debt in its business. But is this debt a concern to shareholders?
What Risk Does Debt Bring?
Debt assists a business until the business has trouble paying it off, either with new capital or with free cash flow. Part and parcel of capitalism is the process of ‘creative destruction’ where failed businesses are mercilessly liquidated by their bankers. However, a more frequent (but still costly) occurrence is where a company must issue shares at bargain-basement prices, permanently diluting shareholders, just to shore up its balance sheet. Of course, plenty of companies use debt to fund growth, without any negative consequences. When we examine debt levels, we first consider both cash and debt levels, together.
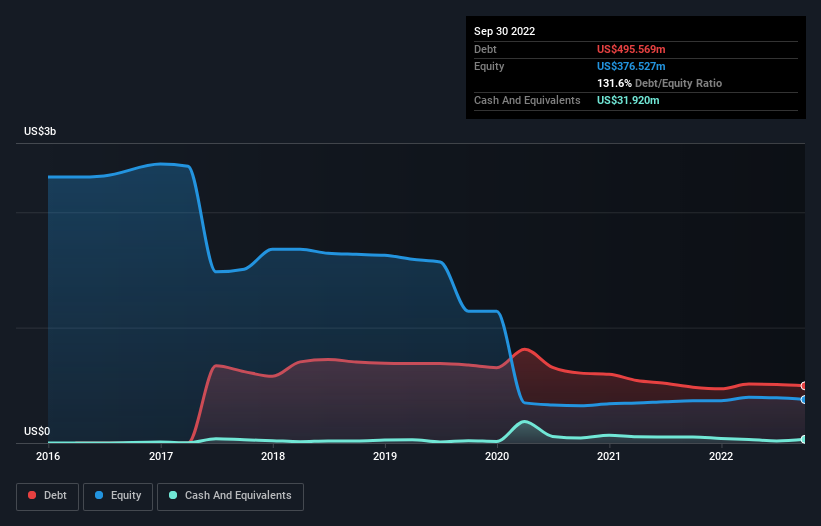
As you can see below, Cars.com had US$495.6m of debt, at September 2022, which is about the same as the year before. You can click the chart for greater detail. However, it also had US$31.9m in cash, and so its net debt is US$463.6m.
What Is Cars.com’s Net Debt?
A Look At Cars.com’s Liabilities
The latest balance sheet data shows that Cars.com had liabilities of US$106.2m due within a year, and liabilities of US$567.4m falling due after that. On the other hand, it had cash of US$31.9m and US$107.0m worth of receivables due within a year. So its liabilities outweigh the sum of its cash and (near-term) receivables by US$534.8m.
Cars.com has a market capitalization of US$902.6m, so it could very likely raise cash to ameliorate its balance sheet, if the need arose. However, it is still worthwhile taking a close look at its ability to pay off debt.
We measure a company’s debt load relative to its earnings power by looking at its net debt divided by its earnings before interest, tax, depreciation, and amortization (EBITDA) and by calculating how easily its earnings before interest and tax (EBIT) cover its interest expense (interest cover). Thus we consider debt relative to earnings both with and without depreciation and amortization expenses.
While Cars.com’s debt to EBITDA ratio (3.1) suggests that it uses some debt, its interest cover is very weak, at 1.5, suggesting high leverage. In large part that’s due to the company’s significant depreciation and amortisation charges, which arguably mean its EBITDA is a very generous measure of earnings, and its debt may be more of a burden than it first appears. So shareholders should probably be aware that interest expenses appear to have really impacted the business lately. Investors should also be troubled by the fact that Cars.com saw its EBIT drop by 12% over the last twelve months. If things keep going like that, handling the debt will about as easy as bundling an angry house cat into its travel box. There’s no doubt that we learn most about debt from the balance sheet. But ultimately the future profitability of the business will decide if Cars.com can strengthen its balance sheet over time.
But our final consideration is also important, because a company cannot pay debt with paper profits; it needs cold hard cash. So the logical step is to look at the proportion of that EBIT that is matched by actual free cash flow. Happily for any shareholders, Cars.com actually produced more free cash flow than EBIT over the last three years. That sort of strong cash conversion gets us as excited as the crowd when the beat drops at a Daft Punk concert.
Our View
Neither Cars.com’s ability to cover its interest expense with its EBIT nor its EBIT growth rate gave us confidence in its ability to take on more debt. But the good news is it seems to be able to convert EBIT to free cash flow with ease. Taking the abovementioned factors together we do think Cars.com’s debt poses some risks to the business. While that debt can boost returns, we think the company has enough leverage now. The balance sheet is clearly the area to focus on when you are analysing debt.


