
Howard Marks put it nicely when he said that, rather than worrying about share price volatility, ‘The possibility of permanent loss is the risk I worry about… and every practical investor I know worries about.’ So it seems the smart money knows that debt – which is usually involved in bankruptcies – is a very important factor, when you assess how risky a company is. Importantly, The Williams Companies, Inc. (NYSE:WMB) does carry debt. But should shareholders be worried about its use of debt?
Why Does Debt Bring Risk?
Generally speaking, debt only becomes a real problem when a company can’t easily pay it off, either by raising capital or with its own cash flow. Part and parcel of capitalism is the process of ‘creative destruction’ where failed businesses are mercilessly liquidated by their bankers. However, a more usual (but still expensive) situation is where a company must dilute shareholders at a cheap share price simply to get debt under control. Of course, plenty of companies use debt to fund growth, without any negative consequences. When we examine debt levels, we first consider both cash and debt levels, together.
How Much Debt Does Williams Companies Carry?
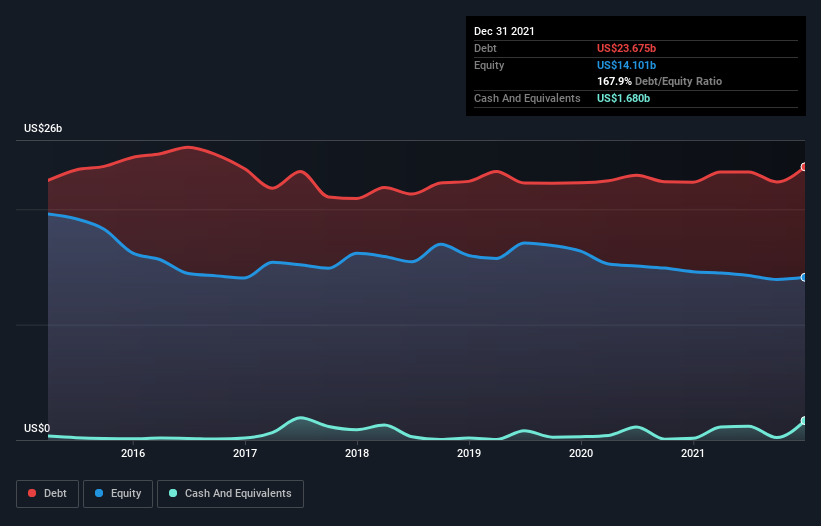
You can click the graphic below for the historical numbers, but it shows that as of December 2021 Williams Companies had US$23.7b of debt, an increase on US$22.3b, over one year. However, it does have US$1.68b in cash offsetting this, leading to net debt of about US$22.0b.
How Healthy Is Williams Companies’ Balance Sheet?
According to the last reported balance sheet, Williams Companies had liabilities of US$4.97b due within 12 months, and liabilities of US$28.5b due beyond 12 months. Offsetting these obligations, it had cash of US$1.68b as well as receivables valued at US$2.00b due within 12 months. So its liabilities outweigh the sum of its cash and (near-term) receivables by US$29.8b.
This is a mountain of leverage even relative to its gargantuan market capitalization of US$39.1b. Should its lenders demand that it shore up the balance sheet, shareholders would likely face severe dilution.
We use two main ratios to inform us about debt levels relative to earnings. The first is net debt divided by earnings before interest, tax, depreciation, and amortization (EBITDA), while the second is how many times its earnings before interest and tax (EBIT) covers its interest expense (or its interest cover, for short). Thus we consider debt relative to earnings both with and without depreciation and amortization expenses.
While we wouldn’t worry about Williams Companies’s net debt to EBITDA ratio of 4.9, we think its super-low interest cover of 2.3 times is a sign of high leverage. It seems clear that the cost of borrowing money is negatively impacting returns for shareholders, of late. The good news is that Williams Companies improved its EBIT by 3.2% over the last twelve months, thus gradually reducing its debt levels relative to its earnings. The balance sheet is clearly the area to focus on when you are analysing debt. But ultimately the future profitability of the business will decide if Williams Companies can strengthen its balance sheet over time.
Finally, while the tax-man may adore accounting profits, lenders only accept cold hard cash. So we clearly need to look at whether that EBIT is leading to corresponding free cash flow. Over the last three years, Williams Companies recorded free cash flow worth a fulsome 85% of its EBIT, which is stronger than we’d usually expect. That puts it in a very strong position to pay down debt.
Our View
Neither Williams Companies’s ability to cover its interest expense with its EBIT nor its net debt to EBITDA gave us confidence in its ability to take on more debt. But its conversion of EBIT to free cash flow tells a very different story, and suggests some resilience. Looking at all the angles mentioned above, it does seem to us that Williams Companies is a somewhat risky investment as a result of its debt. That’s not necessarily a bad thing, since leverage can boost returns on equity, but it is something to be aware of. When analysing debt levels, the balance sheet is the obvious place to start.