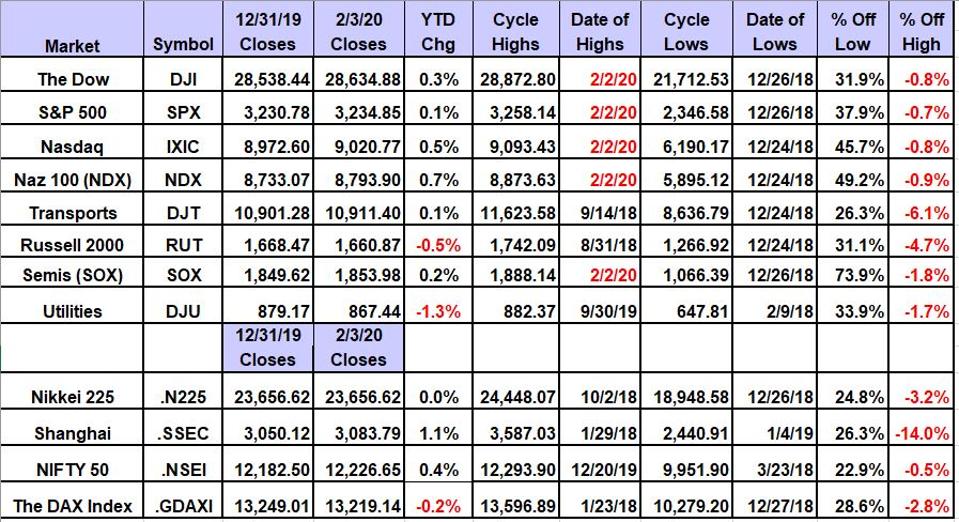
The Dow Jones Industrial Average, S&P 500 and Nasdaq Composite set new all-time intraday highs on January 2 at 28,872.80, 3,258.14 and 9,093.43, respectively. These major averages still show the longer-term warnings I call “inflating parabolic bubbles” on their weekly charts.
This week’s risky levels are 28,864 Dow, 3,266.3 S&P 500 and 9,100 Nasdaq, which lines up with a retest of the January 2 highs.
The year end closes on December 31 were important inputs to my proprietary analytics. We now have new semiannual and annual risky levels and new monthly and quarterly value levels which set the stage for evaluating the risk/reward for at least the first half of 2020.
Here’s Last Week’s Scorecard
The Dow (28,635 on January 3) has upside potential to annual and semiannual risky levels at 29,964 and 30,361, which limits the upside to 5% to 6.4%. The value level for January is 27,579, with the first quarter value level at 27,432. I do not show value levels below these key levels. The daily chart shows downside risk to the 200-day simple moving average that is rising at 26,755. The weekly chart shows downside risk to its 200-week simple moving average or reversion to the mean, which is rising at 23,122. This was last tested during the week of February 12, 2016 when the average was 15,819.
The S&P 500 (3,234.85 on January 3) has upside potential to semiannual and annual risky levels at 3,303.4 and 3,466.5, which limits the upside to 2.2% to 7%. The value level for January is 3,102.5 with the first quarter value level at 3,103.0. I do not show value levels below these key levels. The daily chart shows downside risk to the 200-day simple moving average that is rising at 2,972.03. The weekly chart shows downside risk to its 200-week simple moving average or reversion to the mean that is rising at 2,583.80. This was last tested during the week of December 28, 2018 when the average was 2,349.
The Nasdaq Composite (9,020.77 on January 3) has upside potential to semiannual and annual risky levels at 9,074 and 9,352, which limits the upside to 1.1% to 4.2%. The value level for January is 8,460 with the first quarter value level at 8,860. I do not show value levels below these key levels. The daily chart shows downside risk to the 200-day simple moving average which is rising at 8,124.5. The weekly chart shows downside risk to its 200-week simple moving average or reversion to the mean, which is rising at 6,755.6. This has not been tested over the last five years.
The Dow Transportation Average (10,911 on January 3) has upside potential to semiannual and annual risky levels at 12,155 and 12,755, which projects upside of 11.5% to 17% that implies market leadership on strength. The value level for January is 10,164 with the first quarter value level at 10,349. I do not show value levels below these key levels. The daily chart shows its 200-day simple moving average at 10,504 and rising. The weekly chart shows downside risk to its 200-week simple moving average or reversion to the mean, which is rising at 9,737.35 that was last tested at 9,108.77 during the week of January 4, 2019. The all-time intraday high of 11,623.58 was set back on September 14, 2018.
The Russell 2000 (1,660.86 on January 3) has upside potential to semiannual and annual risky levels at 1,831.90 and 1,910.58, which projects upside of 9.8% to 14.5% which implies market leadership on strength. The value level for January is 1,552.96 with the first quarter value level at 1,610.55. I do not show value levels below these key levels. The daily chart shows its 200-day simple moving average at 1,557.49 and rising. The weekly chart shows downside risk to its 200-week simple moving average or reversion to the mean, which is rising at 1,453.58 that was last tested at 1,354.86 during the week of January 4, 2019. The all-time intraday high of 1,742.09 was set back on August 31, 2018. Remember that December 27 was a downside “key reversal” day with a close at 1,669.03.
How to use my value levels and risky levels:
The closes on December 31, 2019 were inputs to my proprietary analytics and resulted in new monthly, quarterly, semiannual and annual levels. Each uses the last nine closes in these time horizons.
New weekly levels are calculated after the end of each week. New monthly levels occur after the close of each month. New quarterly levels occur at the end of each quarter. Semiannual levels are updated at mid-year. Annual levels are in play all year long.
My theory is that nine years of volatility between closes are enough to assume that all possible bullish or bearish events for the stock are factored in.
To capture share price volatility investors should buy on weakness to a value level and reduce holdings on strength to a risky level. A pivot is a value level or risky level that was violated within its time horizon. Pivots act as magnets that have a high probability of being tested again before its time horizon expires.
How to use 12x3x3 Weekly Slow Stochastic Readings:
My choice of using 12x3x3 weekly slow stochastic readings was based upon back-testing many methods of reading share-price momentum with the objective of finding the combination that resulted in the fewest false signals. I did this following the stock market crash of 1987, so I have been happy with the results for more than 30 years.
The stochastic reading covers the last 12 weeks of highs, lows and closes for the stock. There is a raw calculation of the differences between the highest high and lowest low versus the closes. These levels are modified to a fast reading and a slow reading and I found that the slow reading worked the best.
The stochastic reading scales between 00.00 and 100.00 with readings above 80.00 considered overbought and readings below 20.00 considered oversold.
A reading above 90.00 is considered an “inflating parabolic bubble” formation that is typically followed by a decline of 10% to 20% over the next three to five months.
A reading below 10.00 is considered as being “too cheap to ignore,” which typically is followed by gains of 10% to 20% over the next three to five months.