
Warren Buffett famously said, ‘Volatility is far from synonymous with risk.’ So it seems the smart money knows that debt – which is usually involved in bankruptcies – is a very important factor, when you assess how risky a company is. As with many other companies Kadant Inc. (NYSE:KAI) makes use of debt. But the more important question is: how much risk is that debt creating?
When Is Debt Dangerous?
Debt and other liabilities become risky for a business when it cannot easily fulfill those obligations, either with free cash flow or by raising capital at an attractive price. If things get really bad, the lenders can take control of the business. However, a more common (but still painful) scenario is that it has to raise new equity capital at a low price, thus permanently diluting shareholders. Of course, the upside of debt is that it often represents cheap capital, especially when it replaces dilution in a company with the ability to reinvest at high rates of return. When we examine debt levels, we first consider both cash and debt levels, together.
How Much Debt Does Kadant Carry?
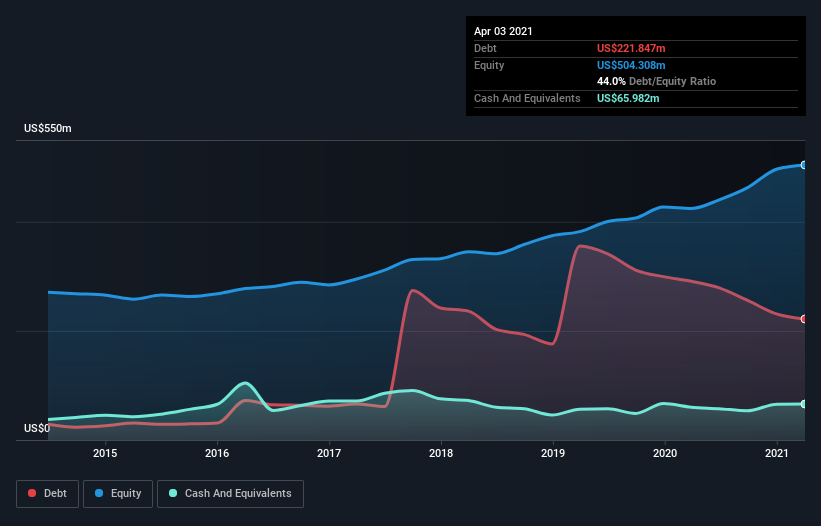
You can click the graphic below for the historical numbers, but it shows that Kadant had US$216.0m of debt in April 2021, down from US$290.9m, one year before. However, because it has a cash reserve of US$66.0m, its net debt is less, at about US$150.0m.
How Healthy Is Kadant’s Balance Sheet?
We can see from the most recent balance sheet that Kadant had liabilities of US$146.6m falling due within a year, and liabilities of US$284.8m due beyond that. Offsetting this, it had US$66.0m in cash and US$110.6m in receivables that were due within 12 months. So its liabilities total US$254.8m more than the combination of its cash and short-term receivables.
Given Kadant has a market capitalization of US$2.12b, it’s hard to believe these liabilities pose much threat. However, we do think it is worth keeping an eye on its balance sheet strength, as it may change over time.
We use two main ratios to inform us about debt levels relative to earnings. The first is net debt divided by earnings before interest, tax, depreciation, and amortization (EBITDA), while the second is how many times its earnings before interest and tax (EBIT) covers its interest expense (or its interest cover, for short). Thus we consider debt relative to earnings both with and without depreciation and amortization expenses.
Kadant’s net debt is only 1.3 times its EBITDA. And its EBIT covers its interest expense a whopping 15.0 times over. So we’re pretty relaxed about its super-conservative use of debt. Fortunately, Kadant grew its EBIT by 3.8% in the last year, making that debt load look even more manageable. The balance sheet is clearly the area to focus on when you are analysing debt. But ultimately the future profitability of the business will decide if Kadant can strengthen its balance sheet over time.
Finally, a business needs free cash flow to pay off debt; accounting profits just don’t cut it. So we always check how much of that EBIT is translated into free cash flow. Over the last three years, Kadant recorded free cash flow worth a fulsome 86% of its EBIT, which is stronger than we’d usually expect. That positions it well to pay down debt if desirable to do so.
Our View
Happily, Kadant’s impressive interest cover implies it has the upper hand on its debt. And the good news does not stop there, as its conversion of EBIT to free cash flow also supports that impression! Looking at the bigger picture, we think Kadant’s use of debt seems quite reasonable and we’re not concerned about it. While debt does bring risk, when used wisely it can also bring a higher return on equity. When analysing debt levels, the balance sheet is the obvious place to start. However, not all investment risk resides within the balance sheet – far from it.