
Howard Marks put it nicely when he said that, rather than worrying about share price volatility, ‘The possibility of permanent loss is the risk I worry about… and every practical investor I know worries about.’ When we think about how risky a company is, we always like to look at its use of debt, since debt overload can lead to ruin. Importantly, Golden Ocean Group Limited (NASDAQ:GOGL) does carry debt. But the real question is whether this debt is making the company risky.
When Is Debt A Problem?
Debt is a tool to help businesses grow, but if a business is incapable of paying off its lenders, then it exists at their mercy. If things get really bad, the lenders can take control of the business. However, a more frequent (but still costly) occurrence is where a company must issue shares at bargain-basement prices, permanently diluting shareholders, just to shore up its balance sheet. Of course, debt can be an important tool in businesses, particularly capital heavy businesses. The first step when considering a company’s debt levels is to consider its cash and debt together.
What Is Golden Ocean Group’s Debt?
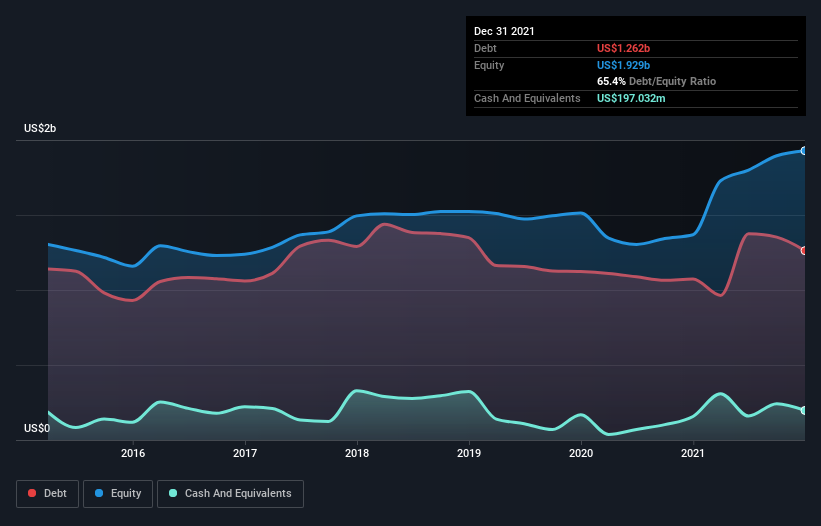
The image below, which you can click on for greater detail, shows that at December 2021 Golden Ocean Group had debt of US$1.26b, up from US$1.07b in one year. However, because it has a cash reserve of US$197.0m, its net debt is less, at about US$1.07b.
How Healthy Is Golden Ocean Group’s Balance Sheet?
We can see from the most recent balance sheet that Golden Ocean Group had liabilities of US$248.1m falling due within a year, and liabilities of US$1.28b due beyond that. On the other hand, it had cash of US$197.0m and US$109.7m worth of receivables due within a year. So it has liabilities totalling US$1.22b more than its cash and near-term receivables, combined.
This deficit isn’t so bad because Golden Ocean Group is worth US$2.44b, and thus could probably raise enough capital to shore up its balance sheet, if the need arose. But it’s clear that we should definitely closely examine whether it can manage its debt without dilution.
We use two main ratios to inform us about debt levels relative to earnings. The first is net debt divided by earnings before interest, tax, depreciation, and amortization (EBITDA), while the second is how many times its earnings before interest and tax (EBIT) covers its interest expense (or its interest cover, for short). This way, we consider both the absolute quantum of the debt, as well as the interest rates paid on it.
Golden Ocean Group’s net debt to EBITDA ratio of about 1.7 suggests only moderate use of debt. And its commanding EBIT of 12.9 times its interest expense, implies the debt load is as light as a peacock feather. Better yet, Golden Ocean Group grew its EBIT by 1,426% last year, which is an impressive improvement. That boost will make it even easier to pay down debt going forward. There’s no doubt that we learn most about debt from the balance sheet. But it is future earnings, more than anything, that will determine Golden Ocean Group’s ability to maintain a healthy balance sheet going forward.
Finally, while the tax-man may adore accounting profits, lenders only accept cold hard cash. So we always check how much of that EBIT is translated into free cash flow. During the last three years, Golden Ocean Group produced sturdy free cash flow equating to 54% of its EBIT, about what we’d expect. This cold hard cash means it can reduce its debt when it wants to.
Our View
Happily, Golden Ocean Group’s impressive interest cover implies it has the upper hand on its debt. But truth be told we feel its level of total liabilities does undermine this impression a bit. Taking all this data into account, it seems to us that Golden Ocean Group takes a pretty sensible approach to debt. That means they are taking on a bit more risk, in the hope of boosting shareholder returns. When analysing debt levels, the balance sheet is the obvious place to start.